Do you also go back and forth to several data sources to check your analytics because one platform needs to give you the desired analytical view of your business/campaigns? It is a common occurrence in the marketing world. We just crave data and analytics to be in one place.
If you are a HubSpot user, you might be viewing standard HubSpot analytical reports, integrated Google analytics, and seeing social media metrics. You prepare your custom report based on the chosen metrics. And that’s only for your business. What if you want to see how the competitor’s website traffic is performing, which keywords they target, and how effective their social media strategy is? For all this, you probably use tools like SEMRush, Ahrefs, Spyfu, or any other.
That’s a lot of time spent viewing and analyzing data points from different data sources. All these data points are important, and you need them. What do you do to reduce your time spent on viewing and reviewing several data points? Let me know in the comment section. For those who are still struggling with it, Databox is here for you.
Databox lets you and your team get the insights you need to fine-tune your marketing campaigns and see how competitors perform simultaneously. "It is really a neat thing they are doing. You see no direct competition; instead, you look at aggregate data that is really helpful," says Sajeel Qureshi, VP of Operations at Computan.
HubSpot does have in-built reporting for your paid campaigns, social media insights, website reporting, and whatnot. Additionally, I assume you also work around spreadsheets to keep track because you love spreadsheets, which are easy to manage.
Databox makes insights available to everyone from all the sources where your marketing campaigns are running. You can view analytics data from HubSpot Marketing campaigns, HubSpot CRM, Google Analytics, ActiveCampaign, HubSpot Service, Wistia, SEMRush, Drift, Facebook Advertising, YouTube, Twitter, Instagram, and many more sources in just a few clicks on your mobile, desktop, TV or any other source. And, wait, you can also see similar data sets of your competitors.
When you have a similar set of data from a competitor’s website and social media, you clearly see the picture and standing of your marketing campaigns. You can tweak your campaigns accordingly and make them perform better than the previous quarter, month or week. As Databox allows you to list SEMRush data, Ahrefs data, SpyFu, and Buzzsumo all in one place, you get to see all the important metrics in one tool, which is convenient.
Benchmark Groups is Databox’s signature tool, still in its beta form, that allows you to compare your company’s performance with other Databox Benchmark Groups. These Benchmark Groups hold the data from other similar companies. This data comparing feature is anonymous, i.e., you won’t know the data from which set of companies you are viewing, nor can those companies know your company’s name on your data. They will only see the data.
"We can see Benchmark Groups getting integrated with HubSpot or Salesforce, where you will see the data in your CRM's dashboard," Says Sajeel.
Let’s set up the Databox account step by step.
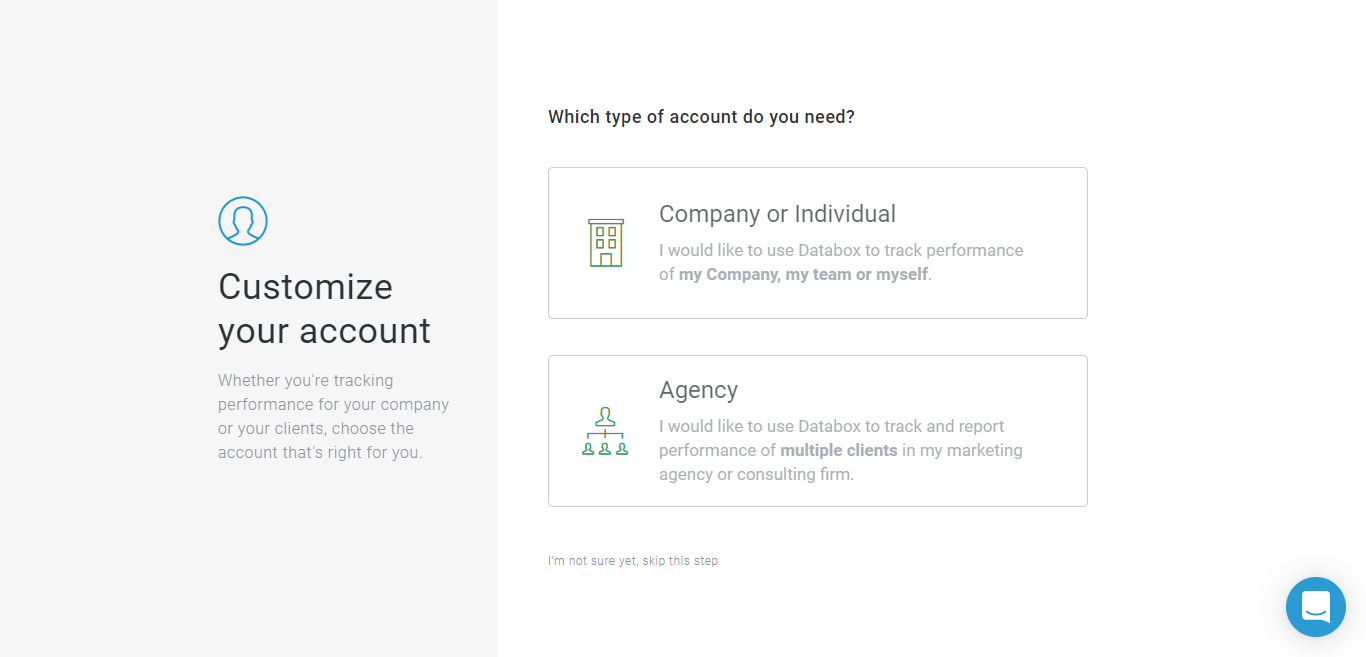
So, the first screen you see when you click signup is the one below. Choose the account type you wish to create.
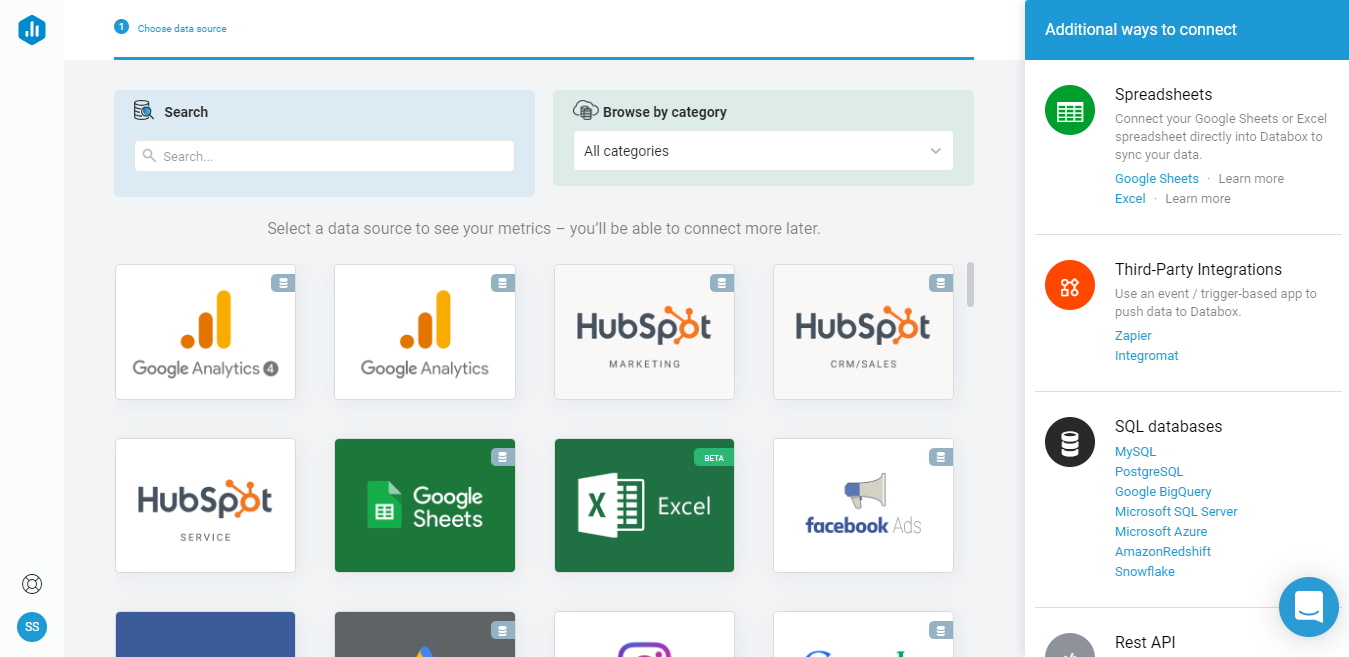
Once you create and verify the account, Databox allows you to choose the data sources. You have HubSpot, Google Spreadsheets, Facebook, Twitter, Shopify, MailChimp, SEMRush, Stripe, Quickbooks, LinkedIn, and Instagram as data sources to choose from.
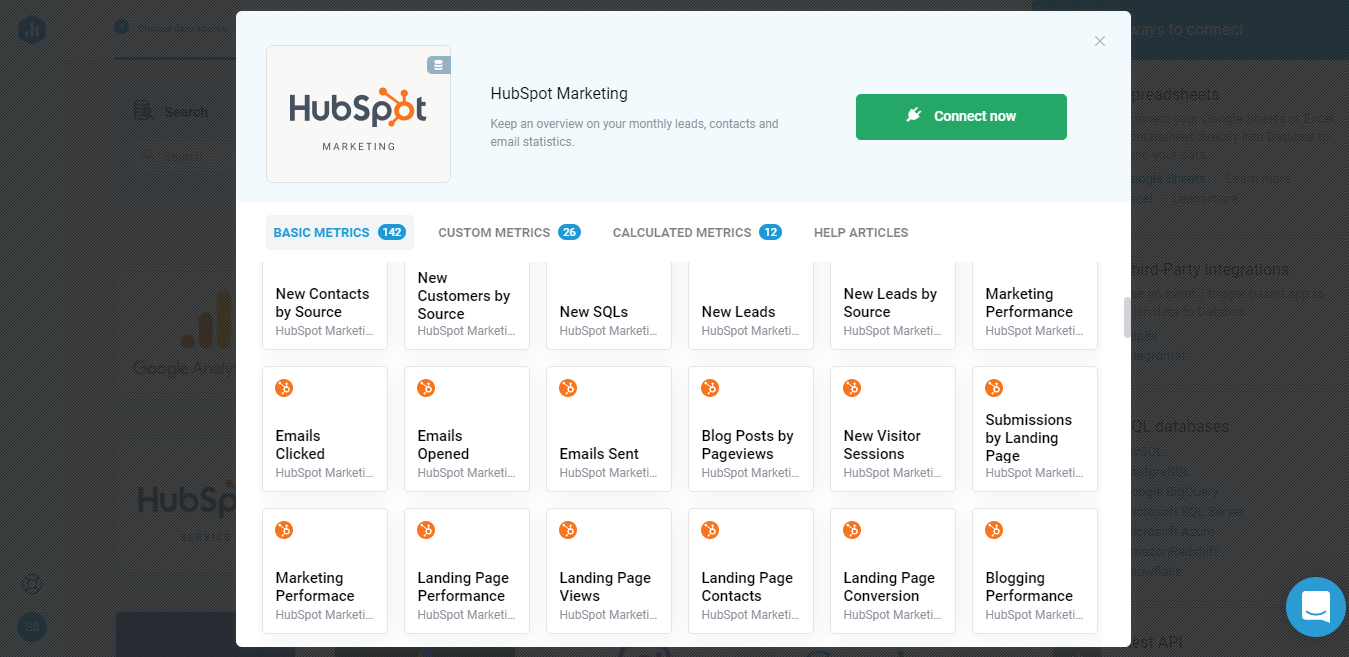
I am sharing an example of HubSpot. If you choose HubSpot, you get the following data points from the data source. Similarly, the data points are available on Facebook, Instagram, and other sources.
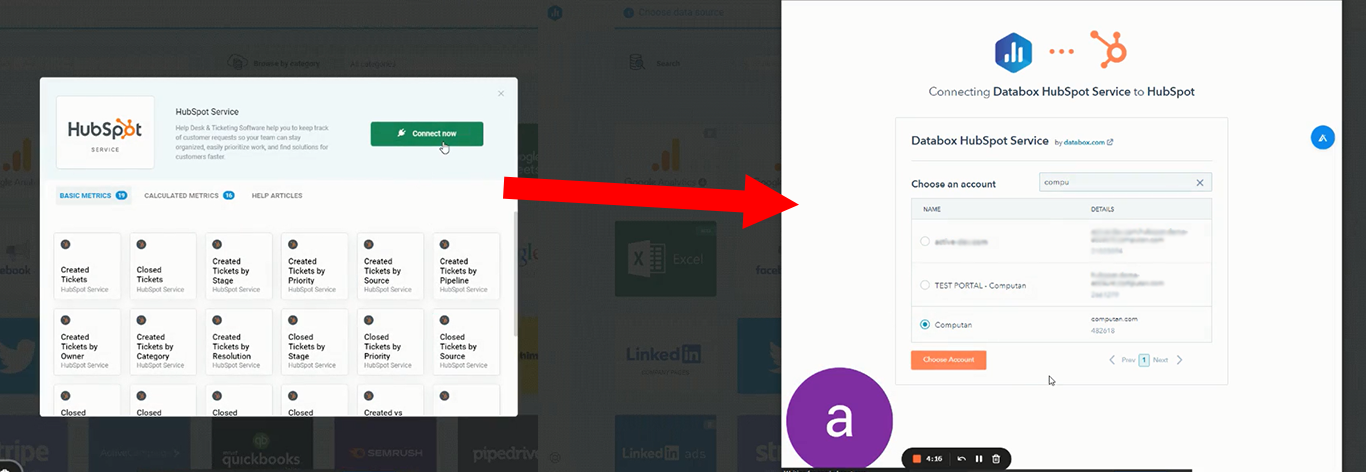
When you click on connect, you are directed to the HubSpot login dialog box, where you choose your HubSpot account to connect to Databox.
Here's what it looks like when you connect your data sources.
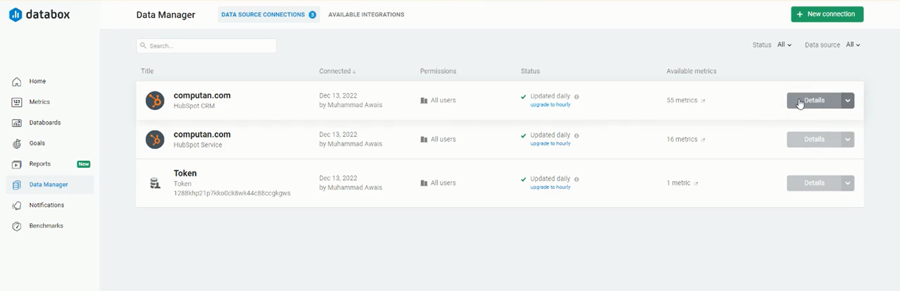
We connected Computan's website analytics and created a Benchmark Group to see our pageviews, users, bounce rate, page views, average time on page, sessions, average session duration, goal conversion, goal completion, and goal value. Here are our findings
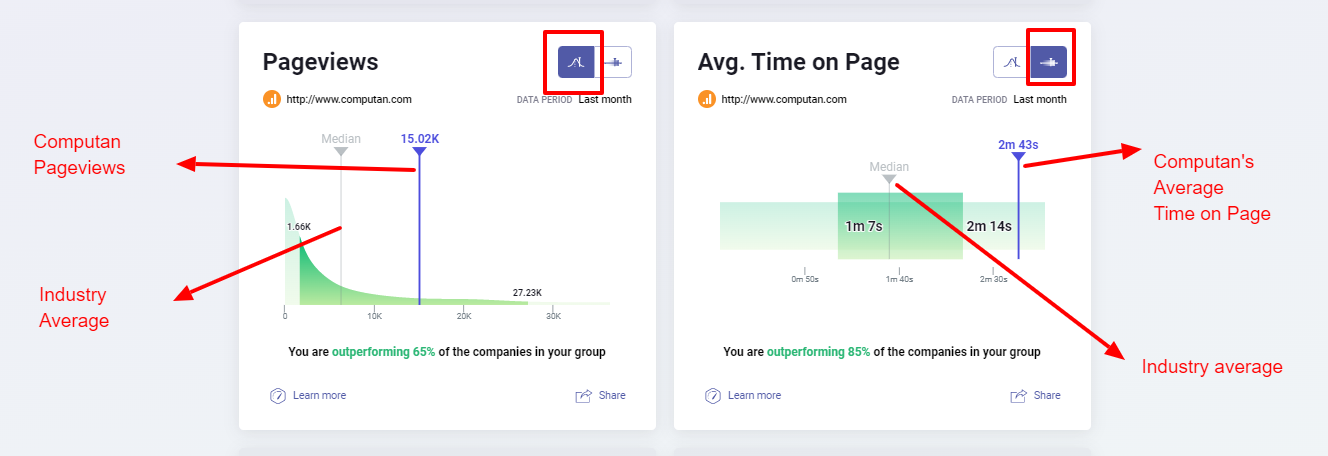
As you can see in the image, we have lower, higher, median, and Computan's analytical stats. As Databox says, they don't reveal the names of other companies whose stats they are using. Similarly, we only see the numbers and not the company names. As Computan uploaded its data, a Benchmark Group was created. The other companies will only see our stat numbers but won't know it is our stat. You can also see two different types of visual representations of the stats.
You see the 'Learn More' button in each title at the bottom left corner of each tile. If you click on that, the following screen is displayed.
.png?width=1313&height=436&name=Benchmark-Groups%20(1).png)
You see the same stats but in the third representation format. This is more of a textual format.
Connecting your analytics to Benchmark by Databox is the same as connecting it to your regular Databox platform, as mentioned above in this blog. It is still in its beta version, but even in this state, it looks promising to be honest. I have high hopes for this tool, and I hope it delivers. "Shopify can make good use of Benchmark groups technology. Merchants will be excited to see sales and other data from similar stores in one place," says Sajeel Qureshi.
Computan Marketing Manager Muhammad Awais connected Computan's Google Analytics to Benchmark Groups by Databox. "It was relatively easy to set up and start using, with a few simple steps to get started. Once set up, the integration allowed us to quickly access important metrics from HubSpot and visualize them in an easy-to-understand dashboard."