Google Analytics comes to mind if we talk about free website analytics tools. This perception is gradually changing, and now Microsoft Clarity might take the top position in the future as the best free website analytics tool Because of many reasons, some of which I will mention in this blog. It gives you exactly what you need to improve your website-audience interaction. Launched on October 28, 2020, Microsoft Clarity can be used on a website of any size. However, it is not available for Finance, medical and Government websites.
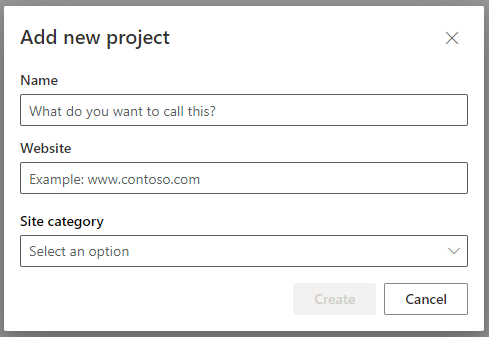
Once you successfully logged into Microsoft Clarity, you start by listing your website under projects. Each website is treated as a separate project in this tool. You put your website name, URL, select its category and generate ‘Clarity Tracking Code.’ You can automatically install the tracking code if you have a Shopify website, Squarespace, Wix, Weebly, ClickFunnels website, WooCommerce, and others. For other platforms, you can do it manually by copying the tracking code and pasting it in the <head> tag. It takes almost 2 hours for Microsoft Clarity to show stats about your website once you paste the tracking code. So, paste the code, sit back, cook something delicious to eat, and right when you are about to do the dishes, you could see the website stats on your Microsoft Clarity dashboard. You can even integrate it with your Google Analytics for detailed reporting.
![]()
Microsoft Clarity Reporting
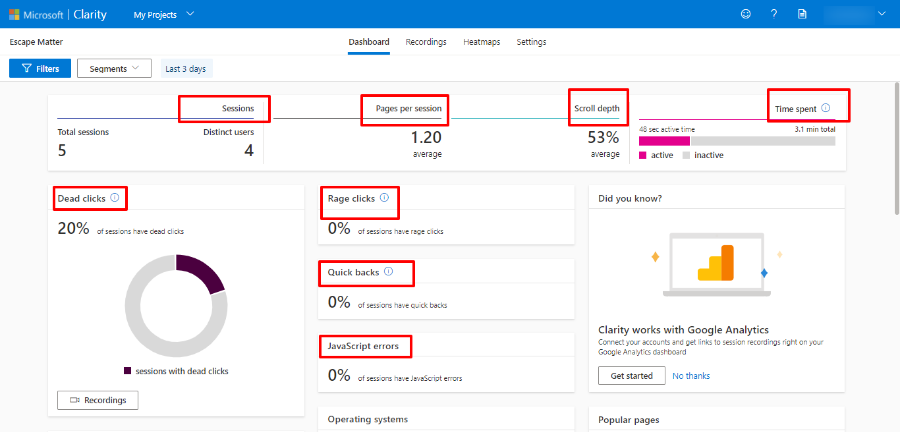
Dashboard
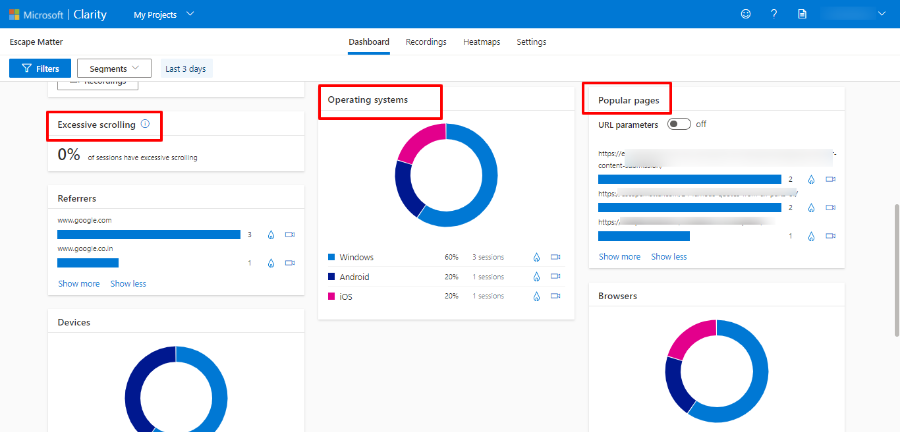
The home dashboard gives you information about sessions, distinct users (these are the same as unique users in Google Analytics), pages per session, scroll depth (till where the users scrolled compared to the total length of the page), dead clicks are those clicks that are done a blank space or don’t have any effect on the page, rage clicks (where the user clicks quickly and rapidly), excessive scrolling (user is scrolling more than the average rate per page. Excessive scrolling is an important metric because it tells you that people on the page are not able to find what they are looking for; that’s why they are scrolling up and down rapidly to find the information. Then the standard popular pages (pages with most clicks), and referrers (websites from where you got the visitors on your website), browser, device, countries, and operating system are standard as in Google Analytics. There are other options as well that are self-explanatory. For example, Microsoft Clarity lists sessions with JavaScript errors. This is something that needs fixing because that might be causing some of the users to exit your website.
Recordings
The next tab you will see is the recordings tab. Here you will see in-depth user behavior per page. Microsoft literally records your website screen and mouse movements and highlights all the clicks in the timeline. You can pause and re-watch from anywhere you want. These recordings are available for all the links, and they are listed page-wise and session-wise.
Heatmap
The next tab is the Heatmap tab. You have the option to view heatmaps for desktops, mobile devices, and tablets. Then choose the link for which you want to see the heatmap. You will see the area that got the most clicked along with the percentage of the clicks. The blue-colored circles mean less clicked, and the red-colored circles mean most clicked.
Heatmaps and recordings: By knowing which part of the page or which buttons on the page got maximum or minimum clicks, you can optimize the position and content of that area for maximum conversions.
Microsoft Clarity vs. Google Analytics
It’s tough to choose when it comes to measuring what your users are doing on your website. Other software tools are available, but Google Analytics leads in many ways because it is free and delivers what it promises to deliver. Microsoft has come very close to Google Analytics to offer some valuable and measurable analytical data to the users.
Both the tools do the job, are easy to use, and of course, are free! Google Analytics offerings are on a large scale, whereas Microsoft Clarity highlights important specifics. Like it answers your basic questions about the website;
- Are your conversions down on a particular page?
- Are people leaving your website quickly?
- Which part of your website are the users accessing quickly?
- Which pages are the users leaving quickly?
You get all of this highlighted in Microsoft Clarity. In Google Analytics, too, you get all of this, but it offers you way much more information that you may or may not use but definitely spend time accessing that information.
No matter which tool you use, you must decide on your goal first. What you want to improve, and the second is what the tool is telling you about your goal. Then you decide to take action to improve things on your website.
If you don’t run a financial, government, or medical website and looking for an alternate for Google Analytics, Microsoft Clarity is definitely your good-to-go tool.
Instead of comparing these two, I think you can use both of these together. Microsoft Clarity has offered an integration option with Google Analytics. You will get the best of both worlds.
We are Developers for Marketers; we literally are…
Whether the website development is being carried from scratch or you want ongoing support from experts, we are there for every bit of the development task.