Tons of website checkup tools are out there that range from a free test to a $1000 monthly subscription. But I will be comparing two free tools to give you the gist of what these tools cover when you check your website. As you pay more for website checker tools, you get results on more parameters.
I checked a common website on the HubSpot Website Grader tool and Google’s PageSpeed tool, and below are the findings.
You first notice that PageSpeed lists mobile and desktop results on two separate pages; however, the HubSpot website grader just has a dedicated section for mobile results.
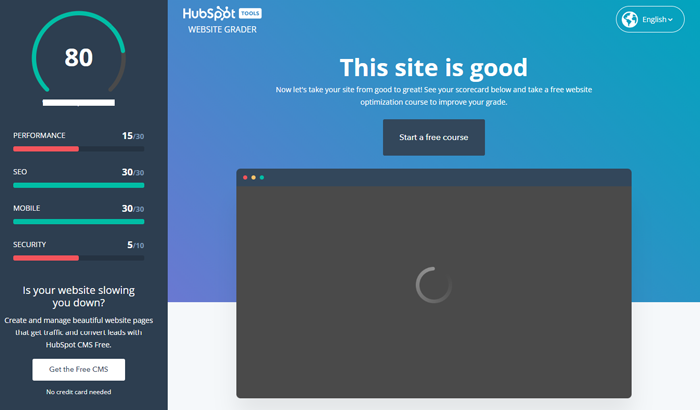
HubSpot website grader overall performance: It shows four metrics on the left side of the screen that it considers while testing the website. All these four are mentioned below on the page. You can see HubSpot promoting its CMS on the left side panel, and in the middle, it is promoting its free courses to improve the website performance. It is a good approach.
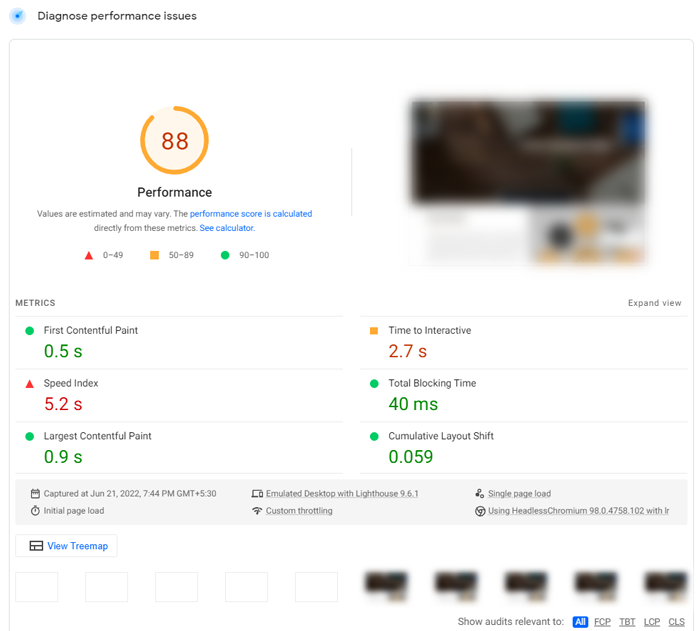
PageSpeed Desktop Overall performance: This is the first glimpse of the PageSpeed results. It does look better than HubSpot grader and has more information. It tells you the time the first content type appeared, the time it took for the website to be interactive, the time for the complete layout, and the largest contentful paint. It does help you in improving speed as you know which part of the website you need to work on to increase website page speed.
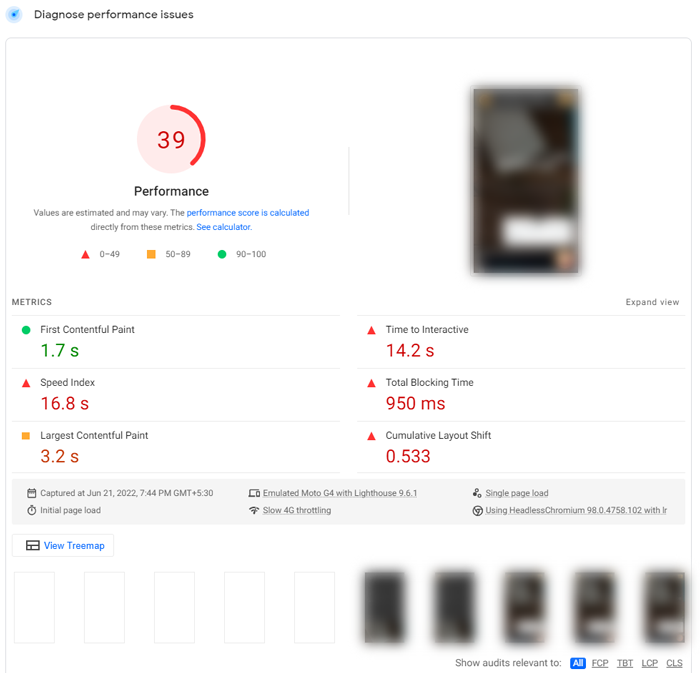
With a single click, you can see the mobile performance of the website as well. The same metrics you saw for Desktop are available for mobile, and you can see the difference. The Desktop score was 88, and the mobile score was 39. The initial insights of PageSpeed are way more detailed than that of HubSpot website grader.
Details of Insights in HubSpot Website Grader
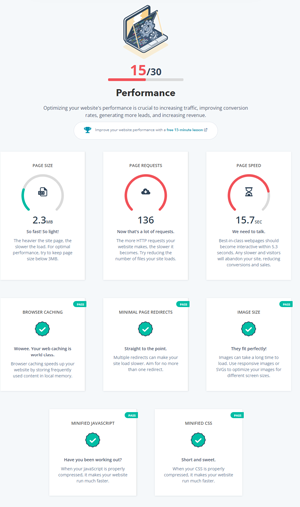
The first graph you see tells you about
Page Size: Lesser the better; that’s the thumb rule. Heavy pages take more time to load. You can reduce the page size by minifying the JS and CSS and optimizing the images for web view. Reducing the redirects or HTTP requests also helps reduce page load time.
Page Requests: Here, the reports 136 requests, which is a lot. You can reduce this by reducing the number of files when your website loads.
Page Speed: The page size was good; it is displayed in green, but the page requests are quite a lot, hampering the page speed; hence we see 15.7 seconds page loading time. This directly affects conversion rates and sales. Users won’t wait that long for the website to load up.
Browser Caching: Browser caching speeds up your website by storing frequently used content of your website in the local memory.
Minimal page Redirects: Again, the lesser, the better. Multiple pages redirects slow down the website. If it is super necessary, then make one redirect.
Image Size: Uploading the exact size of the image you need and optimizing it, and making it responsive help reduce the image loading time.
Minified JS, CSS: Compressed code scripts make your website much faster.
The next parameter that the HubSpot website grader displays in detail are SEO
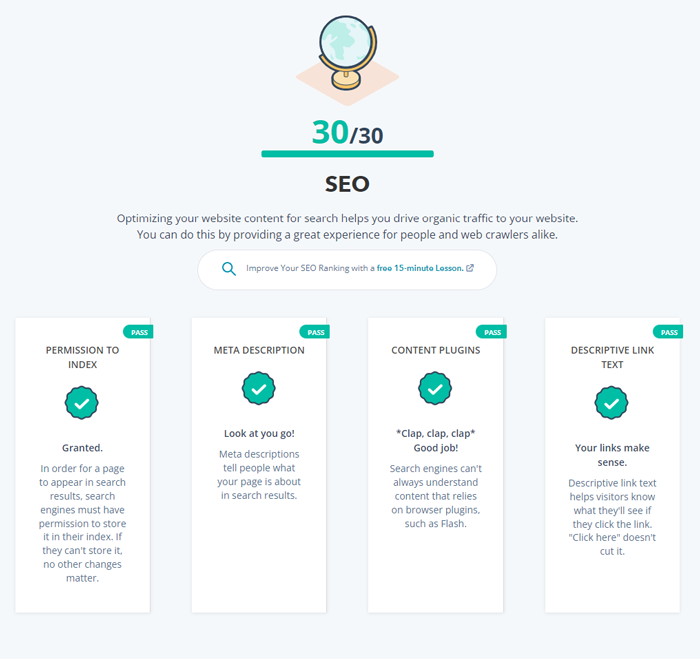
The list of SEO parameters to check on a website is huge. However, HubSpot decided to check four parameters and report those only. Those are:
Permission to Index: To have your webpages appear in search results, the search engines need to crawl those pages and index them. This parameter ensures that all your important web pages are indexed and appear in search results.
Meta description: This is a 170-character description that allows search engines and people to know about the page. Users can know about the page without opening it because meta descriptions and search results on Google appear.
Descriptive Link text: The interlinking done on your website must be done on some descriptive anchor text instead of the ‘click here’ text.
HubSpot Website Grader Mobile Results
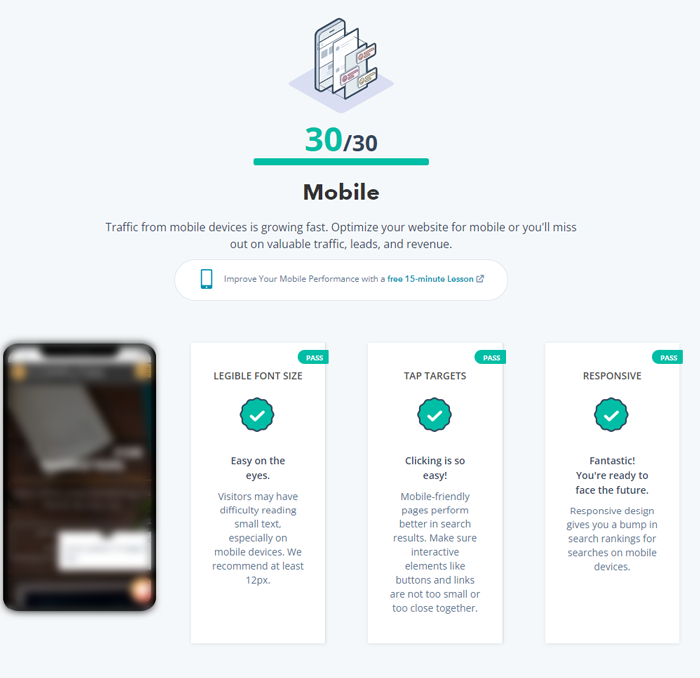
The section displays how well your website is displayed on a mobile device. The screen size is significantly small than a desktop, and people use their fingers on the screen to navigate through the websites. So, the font size and button size must be large enough that users can easily tap on buttons and read text.
HubSpot Website Grader Security

HubSpot website grader performs two security checkups; One for the SSL certificate and the other for the secured libraries. We have a detailed blog on SSL certificates and the best certificate providers, do check that.
HubSpot Website Grader Recommendations
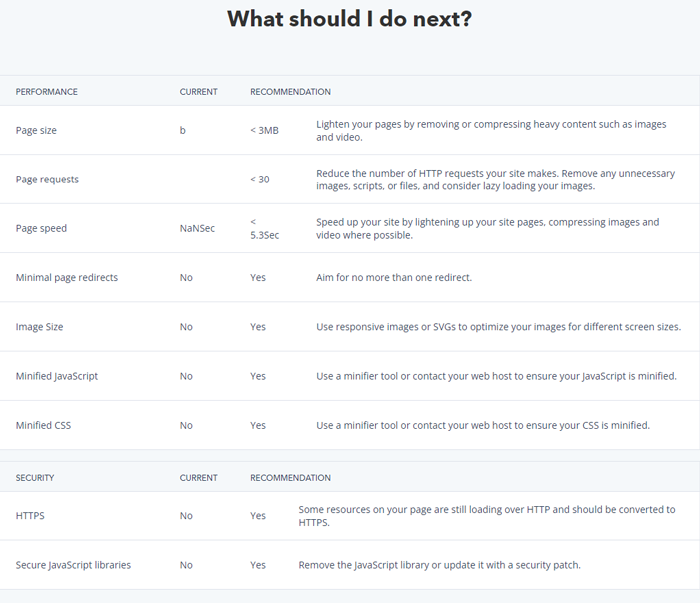
These are standard recommendations for each step discussed above. You shouldn’t skip that because if you look closely, the security section tells that website is secured with HTTPS. However, here in recommendations, in the second last postulate, it tells that some pages are still loading over HTTP and should be converted to HTTPS. That’s why it is important to check the report carefully.
Now, see how Google PageSpeed shows us the website checkup report.
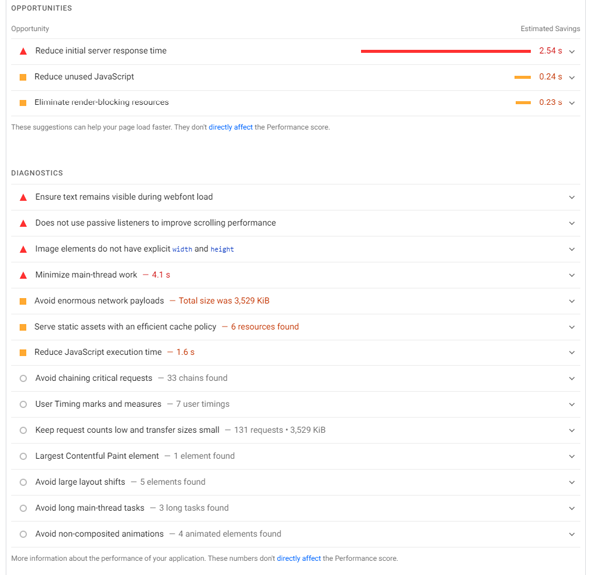
Google PageSpeed Mobile
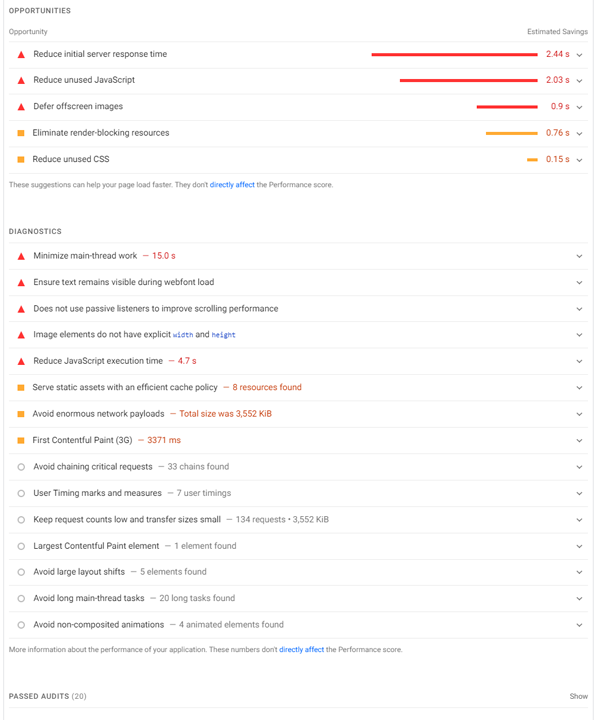
Here you see the same stats you saw in HubSpot Grader, but in a different format.
It displays some additional data, such as server response time, main thread work, and render-blocking resources. And each section has a drop-down from where you get timestamps.
Google PageSpeed Desktop
Google PageSpeed displays similar parameters for Desktop. This is what I love about Google PageSpeed; the tool just doesn’t limit the parameters for mobile. It treats both Desktop and mobile equally.
Server response for mobile and Desktop lets you know whether your server responds well to mobile or desktop requests.
Conclusion
HubSpot’s website grader tool offers slightly lesser detailed stat than Google PageSpeed. If the tool focuses a little bit on more mobile stats, it might be a close competition to PageSpeed, but for now, Google PageSpeed would be my choice for website checkups.